OpenLayers - Align label with Line Feature
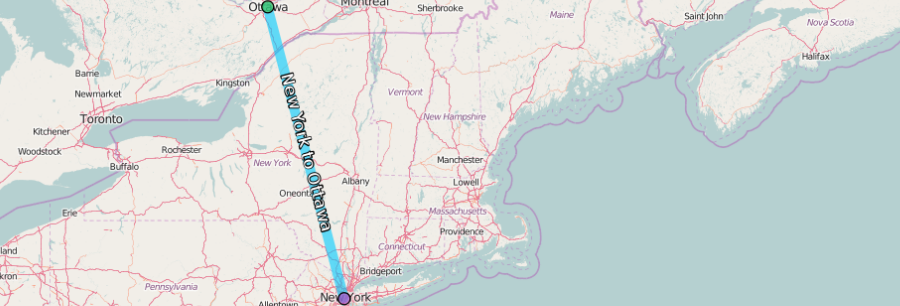
In this short post, we are going to discuss how to display labels on the LineString. This can be useful if you want to add some information along the line, for example, start and destination city:
 Label along the LineString geometry
In our case, the label would be OpenLayer’s Text style for the vector feature. It contains a property named: rotation, which contains rotation in radians (positive rotation clockwise).
In order to calculate rotation value, we need to do bearing to angle conversion (for more information on the math behind this: Calculate distance, bearing, and more between Latitude/Longitude points):
function radians(n) {
    return n * (Math.PI / 180);
}

function degrees(n) {
    return n * (180 / Math.PI);
}

function bearing(start_lat, start_long, end_lat, end_long) {
    start_lat = radians(start_lat);
    start_long = radians(start_long);
    end_lat = radians(end_lat);
    end_long = radians(end_long);

    var dlong = end_long - start_long;

    var dphi = Math.log(Math.tan(end_lat / 2.0 + Math.PI / 4.0) /
            Math.tan(start_lat / 2.0 + Math.PI / 4.0));
    if (Math.abs(dlong) > Math.PI) {
        if (dlong > 0.0)
            dlong = -(2.0 * Math.PI - dlong);
        else
            dlong = (2.0 * Math.PI + dlong);
    }

    return (degrees(Math.atan2(dlong, dphi)) + 360.0) % 360.0;
}

function bearingToRadians(br) {
    return radians((450 - br) % 360);
}

function rotation(pt0, pt1, br) {
    var rotate = pt0[0] > pt1[0] ? Math.PI : 0;
    return bearingToRadians(br) + rotate
}
Here is the source code which adds a label to Line feature and displays text on it, you can view it on github:
function radians(n) {
    return n * (Math.PI / 180);
}

function degrees(n) {
    return n * (180 / Math.PI);
}

function bearing(start_lat, start_long, end_lat, end_long) {
    start_lat = radians(start_lat);
    start_long = radians(start_long);
    end_lat = radians(end_lat);
    end_long = radians(end_long);

    var dlong = end_long - start_long;

    var dphi = Math.log(Math.tan(end_lat / 2.0 + Math.PI / 4.0) /
            Math.tan(start_lat / 2.0 + Math.PI / 4.0));
    if (Math.abs(dlong) > Math.PI) {
        if (dlong > 0.0)
            dlong = -(2.0 * Math.PI - dlong);
        else
            dlong = (2.0 * Math.PI + dlong);
    }

    return (degrees(Math.atan2(dlong, dphi)) + 360.0) % 360.0;
}

function bearingToRadians(br) {
    return radians((450 - br) % 360);
}

function rotation(pt0, pt1, br) {
    var rotate = pt0[0] > pt1[0] ? Math.PI : 0;
    return bearingToRadians(br) + rotate
}

var wsg84_pt1 = [-74.0059, 40.7127];
var wsg84_pt2 = [-75.6972, 45.4215];
// convert to default projection EPSG:3857 Web Mercarator
var pt1 = ol.proj.fromLonLat(wsg84_pt1);
var pt2 = ol.proj.fromLonLat(wsg84_pt2);

var map = new ol.Map({
    layers: [
        new ol.layer.Tile({
            source: new ol.source.OSM()
        })
    ],
    target: 'map',
    view: new ol.View({
        center: pt1,
        zoom: 6
    })
});
var FEATURE_LINE = 0;
var FEATURE_PT1 = 1;
var FEATURE_PT2 = 2;
var line = new ol.Feature({
    geometry: new ol.geom.LineString([pt1, pt2])
});
var pt1_feature = new ol.Feature({
    geometry: new ol.geom.Point(pt1)
});
var pt2_feature = new ol.Feature({
    geometry: new ol.geom.Point(pt2)
});
line.feature_type = FEATURE_LINE;
pt1_feature.feature_type = FEATURE_PT1;
pt2_feature.feature_type = FEATURE_PT2;

var feature_style = function (feature) {
    if (FEATURE_LINE == feature.feature_type) {
        return new ol.style.Style({
            stroke: new ol.style.Stroke({
                color: 'rgba(0, 204, 255, 0.6)',
                width: 10
            }),
            text: new ol.style.Text({
                rotation: -rotation(pt1, pt2, bearing(wsg84_pt1[1], wsg84_pt1[0], wsg84_pt2[1], wsg84_pt2[0])),
                text: 'New York to Ottawa',
                font: '17px sans-serif',
                fill: new ol.style.Fill({color: 'white'}),
                stroke: new ol.style.Stroke({color: 'black', width: 2})
            })
        });
    } else {
        var fill_color;
        switch (feature.feature_type) {
            case FEATURE_PT1:
                fill_color = new ol.style.Fill({color: 'rgba(191, 63, 191, 0.6)'});
                break;
            case FEATURE_PT2:
                fill_color = new ol.style.Fill({color: 'rgba(63, 191, 63, 0.6)'});
                break;
        }
        return new ol.style.Style({
            image: new ol.style.Circle({
                fill: fill_color,
                radius: 6,
                stroke: new ol.style.Stroke({color: 'black', width: 1.25})
            })
        });
    }
};
var vector_source = new ol.source.Vector({});
vector_source.addFeatures([pt1_feature, pt2_feature, line]);
var vector_layer = new ol.layer.Vector({
    source: vector_source,
    map: map,
    style: feature_style
});